
If you are one of the SAP customers who is still running BusinessObjects XI 3.1, I would urge you to add an upgrade to BusinessObjects 4.2 into your immediate plans for 2017. Although SAP has extended priority one support until Dec 2018, this should not mean upgrading your BI environment should be delayed. As the software that supports your […]
Category Archives: BI Platform
Lumira 1.29 – Data Blending Comes of Age
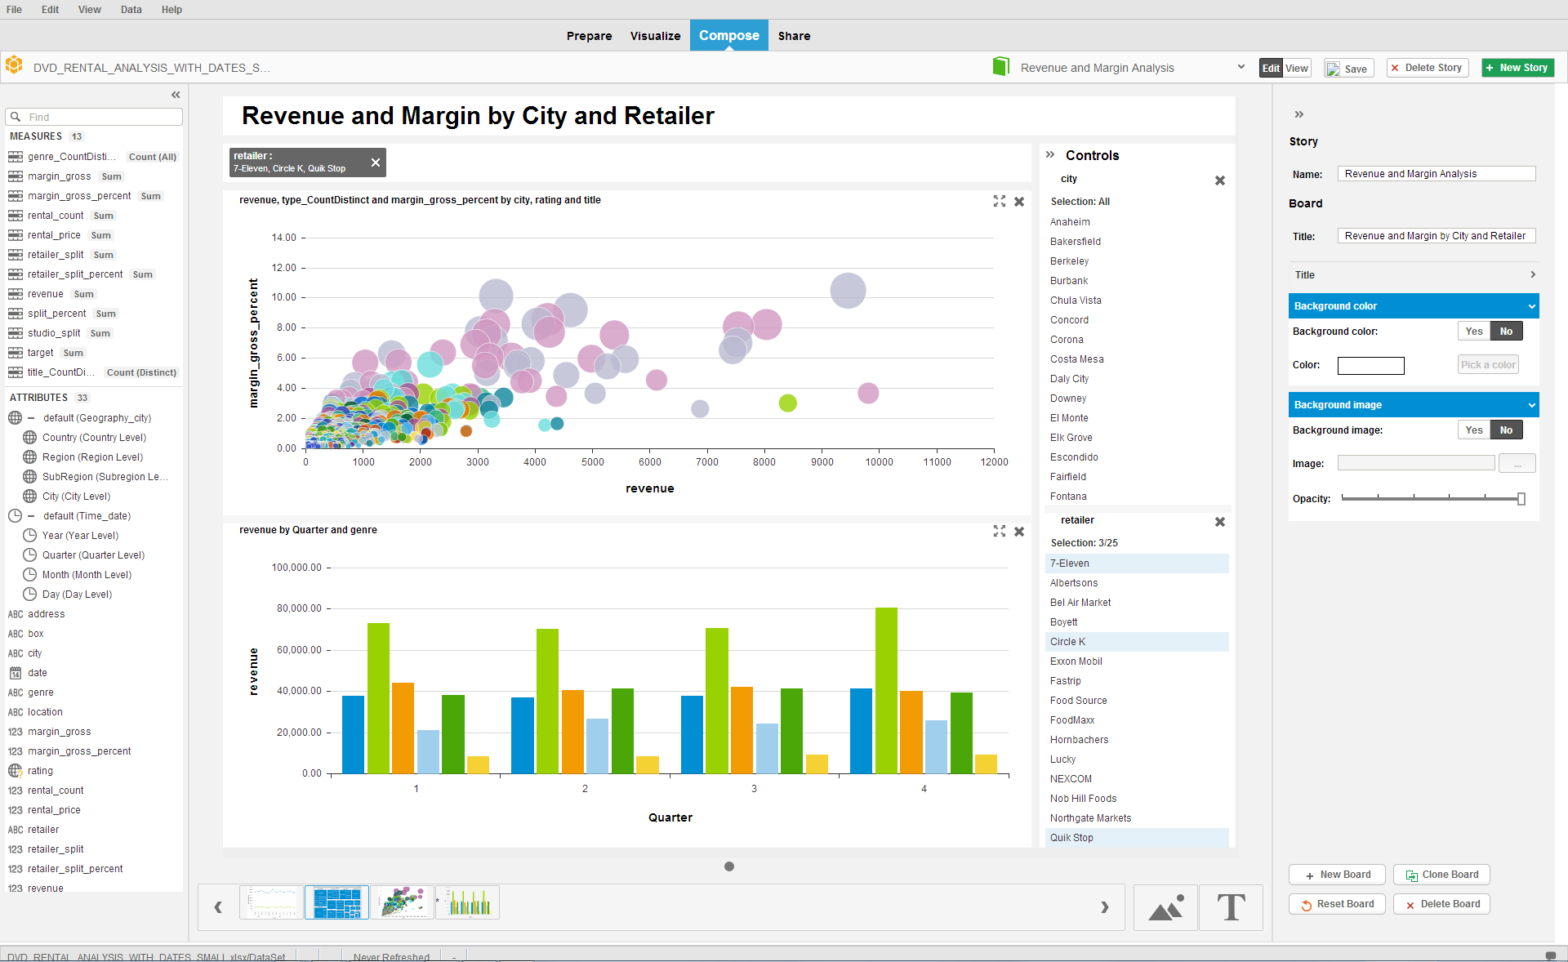
Lumira recently introduced a new concept called Blending. Blending allows Analytics to allow data from multiple datasets or fact tables to be displayed across a common dimension. This was a critical next step in Lumira’s evolution because often the job of an Analyst requires them to pull together multiple result sets into a single visualization. It’s […]
Lumira | Predictive Analysis Troubleshooting: Hangs on the splash screen when starting…
I recently discovered an issue when leveraging both Lumira and Predictive Analysis 1.18 and it took me a while to debug the issue and so I wanted to share those results with you. The version of Lumira/Predictive Analysis I had installed on my desktop had a permanent key with a timeout and I didn’t realize […]
Upgrading to SAP BusinessObjects 4.1
Don’t Miss Out! There is an excellent Technical Webinar Series happening right now: Upgrading to the SAP BusinessObjects BI Platform 4.1 These sessions started back in July and have been an excellent resource for understanding what’s required to upgrade, best practices, SSO, monitoring, strategy and roadmap, etc. For details on the schedule go here. […]
SAP Discusses Latest BI Roadmap
Yesterday, many SAP BusinessObjects customers, mentors, partners and even a few competitors listened in as Steve Lucas as he unveiled SAP’s bold, new analytics strategy. The twittersphere as active as tweets were tracked using #allaccessanalytics, we had a lot of fun. Zimkhita Buwa quipped: Steve emphasized that SAP isn’t delivering a ‘mission accomplished’ banner. It’s just […]