I’ve decided it’s probably a good idea to break down these tutorials a bit. Although I love to share all this information, it’s probably getting a little long for a single post.
Visual Sets
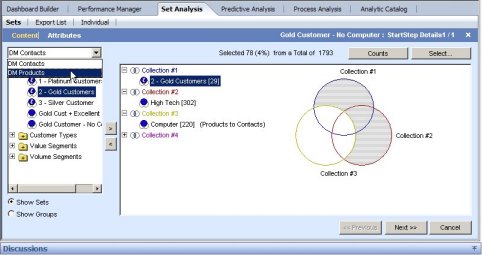
When creating sets in Set Analysis, Visual Sets are extemely helpful. Visual Sets allow you to quick look at the union, intersection, exclusion of multiple sets simultaneously. Let’s say for example I want to see all Gold Customers who are also High Tech Customers but have NOT purchased products from our computer department. Let’s assume I already have the following three sets:
- Gold Customers
- High Tech Customers
- All Products from the Computer Department
Let’s create a new static Set using DM Contacts, called Gold Customer – No Computer. Next we will add a Visual Set. We will chose 3 sets. One set for each of the three Collections.
- Collection 1(blue) – add Gold Customers (All Gold Customers)
- Collection 2 (red) – add High Tech (All High Tech Customers)
- Collection 3 (yellow) – add Computer (All Products in the Computer Department)
In our case we want all Gold Customers who have NOT purchase Products in the Computer department, therefore we do not want to select anything in the yellow circle.
I can click on Counts at any time and the system will show many how many records are in the selected set.
From the selected venn diagram regions, I can see from the displayed count that there are 78 customers who fall into this category. Click Next>>, specify the description and OK to save the set.
Remember, just like before we must build the set before it will contain any objects. Once you build the set you will see there are 78 records retrieved.
Isn’t that easy? How cool is that?
NOTE: Remember how we specified Converters in Set Analyzer Architect? This converter allows us to chose information from DM Products, but have it converted products to contacts. In our example, it converted “products in the computer department”, to contacts who have purchased products from the computer department.


Comments are closed.