They’ve Got Style
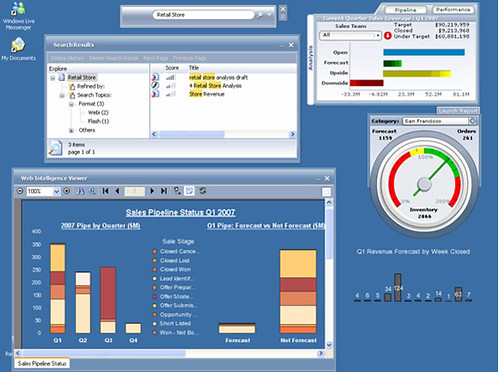
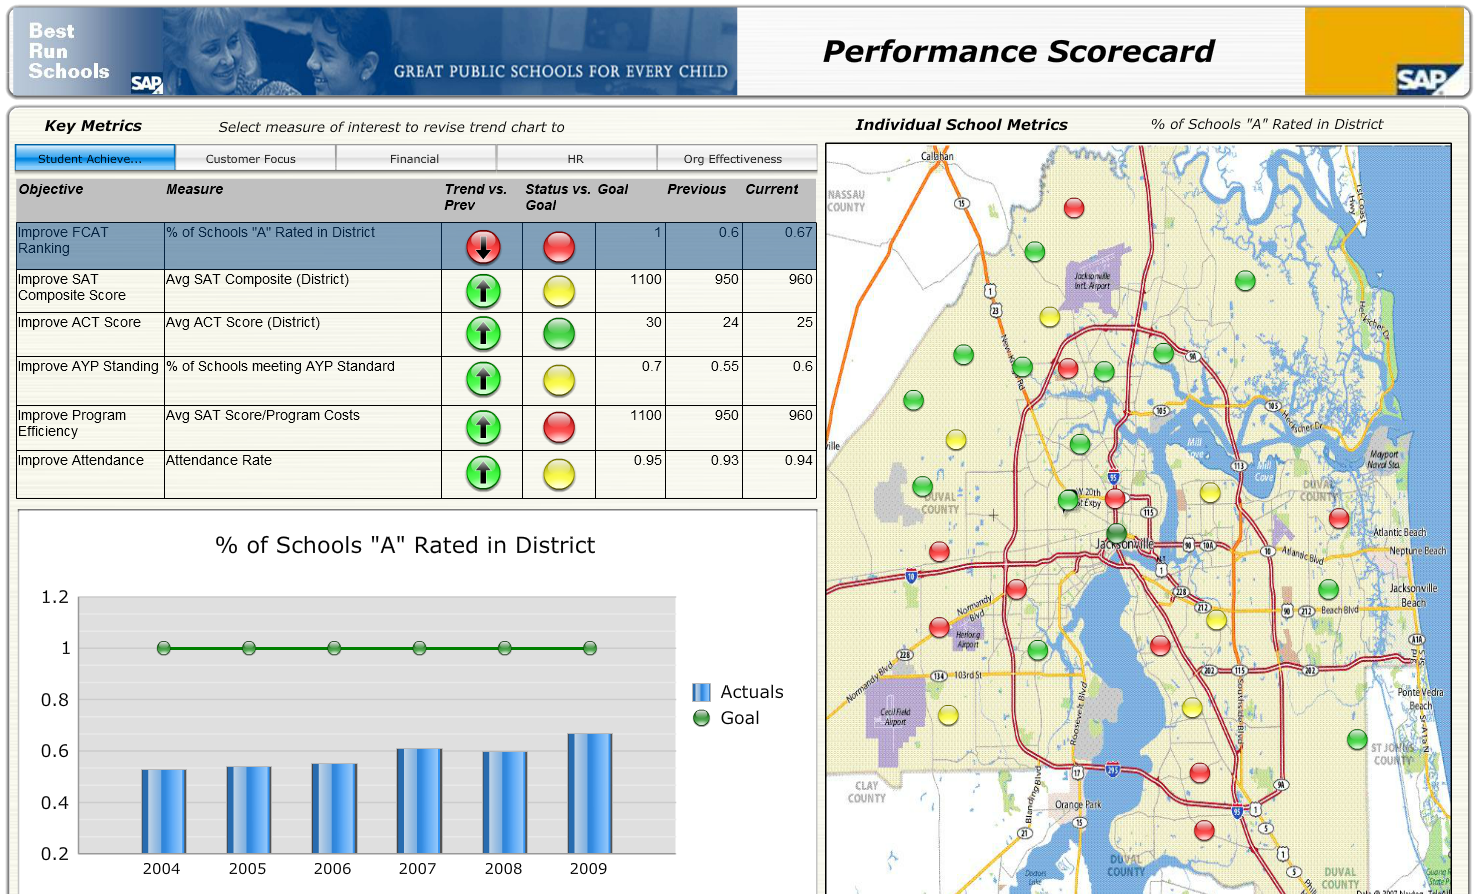
I continue to be amazed by the dashboards being developed by our customers and partners to meet on going business needs. Across every industry and every organization, regardless of size, companies are able to consolidate information into a single, interactive dashboard view. Customers constantly ask me for examples of what other organizations have done, so I decided it was time to assemble a list of the best Xcelsius websites with samples.
Some of my Favorites
- My absolute favorite site is Inverra. They are constantly updating their site with unique KPI centric examples.
http://www.inverra.com/Dashboards/demos.htm - Benchmarkers. Great Design, Xcelsius Experts. Training Provided.
http://www.benchmarkers.com/showcase/ - Analysis Factory. Very professional graphics. Their supply chain example is tops.
http://www.analysisfactory.com/gallery.html - MyXcelsius Showcase.
http://myxcelsius.com/showcase/ - SAP SDN Xcelsius Samples. These samples are either from SAP or have been uploaded from customers.
https://www.sdn.sap.com/irj/boc/xcelsius-samples
Dashboarding Ideas
Need to keep you finger on the pulse of the dashboarding scene? Looking for great ideas around dashboards in general? There is one website above all others that has great information about creating dashboards with both Xcelsius and non-Xcelsius based technologies. The website is Dashboard Spy and I highly recommend you give it a look.
http://dashboardspy.com/
They also have a great list of dashboard screenshots that’s worth a look:
http://dashboardspy.com/screenshots.html
«Good BI»


The East of England is in the vanguard of a new initiative aimed at bringing the power of business dashboard software to the average SME.
UK web applications specialist, Flynet has secured proof of concept funding from the East of England Development Agency (EEDA), allowing the firm to look into the possibility of tailoring DASHBOARD software that usually costs several thousands of pounds to the smaller company.
Ordinarily the preserve of big business, dashboards are a graphical representation – in the form of gauges, dials or graphs – of the performance of a company relative to its main priorities or targets.
We are still looking for SME’s based in the UK (ideally) to take part in the proof of concept study.
Hello David..
I loved your blog. I am a bit new to xcelsius. We as a team are still looking into capabilities of this software. We wanted to have a look at the samples of Xcelsius to give us a start.Thus loved your blog.If possible can you please mail me more such websites.
I found one site missing from your list, which was suggested by someone else.
http://analysis-reporting.blogspot.com
Thanks,
Tom
Dear all,
I only have seen Xcelsius in presentation long time ago. One of my client would like to know if the dashbords made with this tool can be automatically refreshed every 15 minutes, without any interaction of the user side ( no clicks), once the dashbord is open. I don’t know if I’m clear, but his idea is to put a television screen in the working area, and people looking at that television can see the dashbord KPI evolution without any humain interaction. Is this type of functionality already implemented or there is need of specific developments ?
Thank you in advace for your help
Kind regards,
Aurelia
Aurelia,
Sorry for the long delay in getting back to you. I saw your post and had been meaning to get back to you much sooner. With Xcelsius you can automatically have the dashboard poll the database and refresh every X seconds. Alternatively, you can also use web technologies to push information into the dashboard via Flash Variables. With Xcelsius 2008, we can now leverage LCDS so that instead of pulling data from the database you are “pushing” information as it changes. Hope that helps
Hi Taylor,
I just came across your blog, while searching for something.
It’s a wonderful blog. Thanks for all the information that you’re presenting here.
I have added it to my Favorites and would definitely come back to this, when I have specific queries on Business Objects.
I have recently learnt the basics of Xcelsius dashboarding. My client initially liked our dashboards too much but with increasing demand of client we are now facing problems of data handling. Usually our data ranges from 5000-6000 rows in excel. This data is segregated across 3-4 levels of categories and subcategories and time points. Can anyone please suggest me how to handle big amount of data in xcelsius. My client might be ready for paying any thing for seeing large data.
The best thing you can do is reduce the rows with Filtered rows.
512 is the best but you can go over the limit.
In addition when using qaaws make a few qaaws’s and this will reduce the treatment area.
My 2 cents
Going over 512 rows in xcelsius makes the dashboards take long to respond in some cases. better is as said to be within or around the limits.
I have been able to work with over 4,000 rows. It takes a bit of Excel and you have to break up the data between tabs, but it works, opens fast and runs fast. Using Index and Match, if you order your data by the first column, you can select which row the match begins and how many matches there are. With that information, you can move the appropriate rows. Using the Excel formula for finding the first letter allows you to break up your data between tabs and use a long IF statement inside your formulas to search the appropriate tab.
@James
Um -interesting – so are you saying that if i put my 4000 rows onto say 10+ sheets and then do some clever stuff in excel then this works without freezing the flash app. I had all but given up because of the 500 or so row limit I have calculations on the 4000 rows
my other alternative is to put the calc in another app and push data to it via flash – this is where i was headed
If you want to expand the data volume limit in Xcelsius, take a look at antivia (www.antivia.com) Also, Drag and drop design w/o needing spreadsheet, drill down, deploy to mobile and many other enhanced features for Xcelsius Dashboards.
Antivia is a great partner. They also bring dashboards to the iPad! http://www.trustedbi.com/2012/01/16/antivia-on-the-ipad/