 Lumira recently introduced a new concept called Blending. Blending allows Analytics to allow data from multiple datasets or fact tables to be displayed across a common dimension. This was a critical next step in Lumira’s evolution because often the job of an Analyst requires them to pull together multiple result sets into a single visualization. It’s great to be able to visualize actual vs. budget together in a single graph; however often you want to be able to create a new calculation across the datasets, e.g. variance, variance percent, etc. This was not possible before.
Blending Enhancements
On Friday I downloaded the latest release of Lumira — Lumira 1.29. There is a lot here to see and although it’s always great to see more features coming into the product, the enhancements to blending really make this release standout and make this version of Lumira a must-have upgrade.
Lumira has always done a good job at allowing users to manipulate data, but limitations of no micro-cube and the inability to create custom calculations across multiple data sets was extremely limiting. Until now the only options were to:
- Perform data preparation in the microcube of WebIntelligence and access to microcube directly using the APOS Data Gateway
- Hope you could leverage the Join_By_SQL option within the Universe so that only a single result set would be returned.
As you might imagine, this was quite limiting and I ran into this first hand during a recent customer evaluation. Here was my scenario.
Supporting YoY Comparisons
I was asked to calculate the growth factor within a dataset that included data over time. The growth factor was defined as
G = (Volumecy/ Volume(cy-t))1/t – 1
Where t is the time in years. For the purpose of this analysis, t is taken to equal 3, 5 or 10 years. cy is the current year. The example below will use the standard year breakdown.
Example: The table below is used in the example calculations
| 2014 Volume | 2013 Volume | 2012 Volume | 2011 Volume | 2010 Volume |
| 125,452 | 124,118 | 120,506 | 119,987 | 126,623 |
In 2014, the 3 year growth would be:
G = (125,452 / 119,987)1/3 – 1 = 1.5 %
In 2013, the 3 year growth would be:
G = (124,118 / 126,623)1/3 – 1 = -0.66 %
At first what seems so simple, wasn’t.
This is a straight-forward request. With Lumira it wasn’t so simple. When processing a Lumira document, the formula engine processes one record at a time, so prior to blending, the only option was to create custom calculations to filter the volume for each year. I would then have to use these custom calculations in yet another calculation for the growth. Here is a sample.
2014 Volume Custom Calculation: if {Year} = 2014 then {TransCount} else 0
2011 Volume Custom Calculation: if {Year} = 2011 then {TransCount} else 0
2014 3yr Growth: Power(({Transcount_2014} / {Transcount_2011}), 1 / 3) – 1
So for 5 years of 3-yr grow calculations I would have to create 15 formulas! Yikes!
It was possible, but there were two big problems:
- Each year you would have to add more formulas because the calculations weren’t dynamic by year.
- You lost the ability to visualize the data in context. In this case you would not be able to easily show these calculations in a YoY line chart.
Could blending be the answer? Possibly. Here’s what I discovered.
Previous Blending Helped But…
Suddenly I had an idea. What if I loaded the dataset in twice? Once for the current year and again but leverage “Year+3”. This would allow me to join on year and because the value for the year 2011 now say 2014. I could then display the current years value next to the value from 3 years ago. It worked!
Here is what I did.
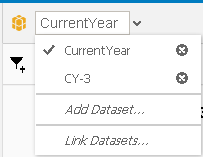
I loaded the same dataset twice and renamed them to Current Year and CY-3.
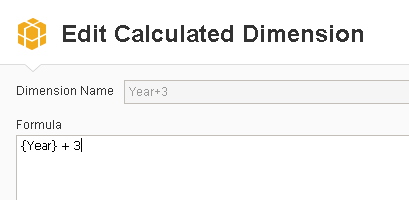
In the dataset named, CY-3, I created a calculated dimension called Year+3 in which I added “+3” to the value of the Year column… so now 2014 became 2017, 2013 became 2016, etc.
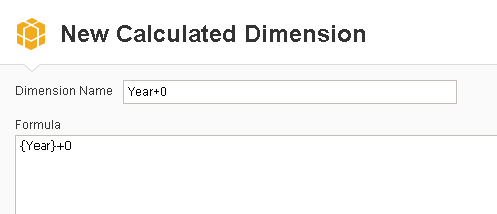
In the previous example when I created Year+3 and added 3 to the Year, the field went from being defined as an integer to a real number. Lumira doesn’t allow you to join across data types and since my original Year column is still defined as an integer, I needed to create a current date which is also a real number. I accomplished this by creating a new calculation dimension called Year+0, by creating a new formula Year+0.
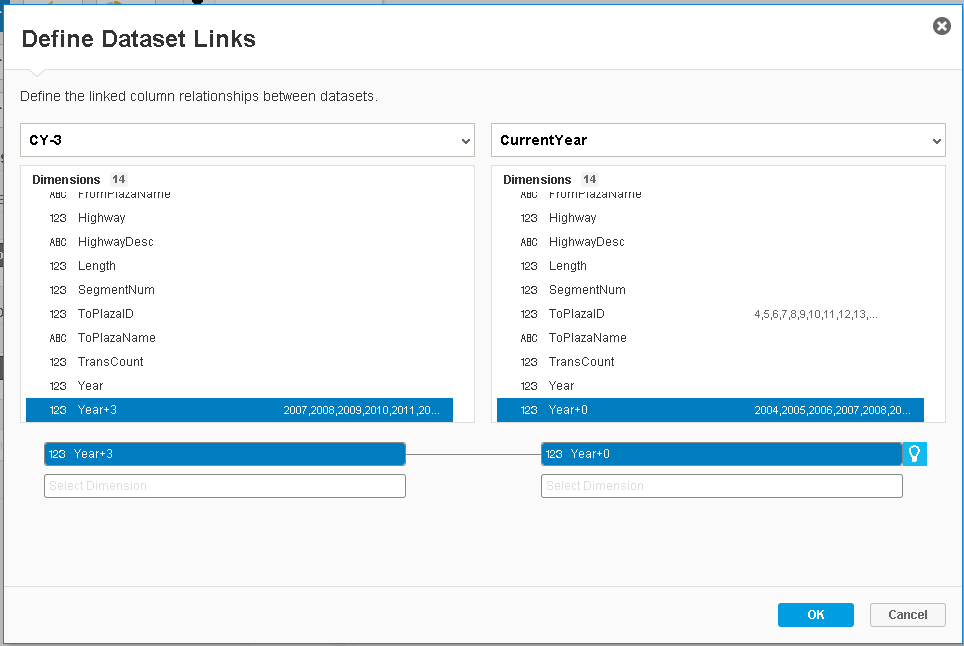
Next I lined the two datasets. I was able to link Year+3 from the CY-3 dataset to the Year+0 from the CurrentYear dataset.
I also renamed the TransCount field in the CY-3 dataset to Transcount (CY-3) to avoid any confusion with the value TransCount in the CurrentYear dataset.
Next I created a column chart visualization showing the data from CurrentYear and the CY-3 datasets together in the same chart in the following manner:
First, Add Year+0 and TransCount to the Column chart. This shows you the current values. Next, change the dataset you are working with to CY-3 and add TransCount (CY-3) to the output. Now I can see the CurrentYear Transcount compared to the Transcount from 3 years earlier. As expected, there are null values for the earliest 3 years because I loaded the same data set twice and my initial calculation is using Year+3.
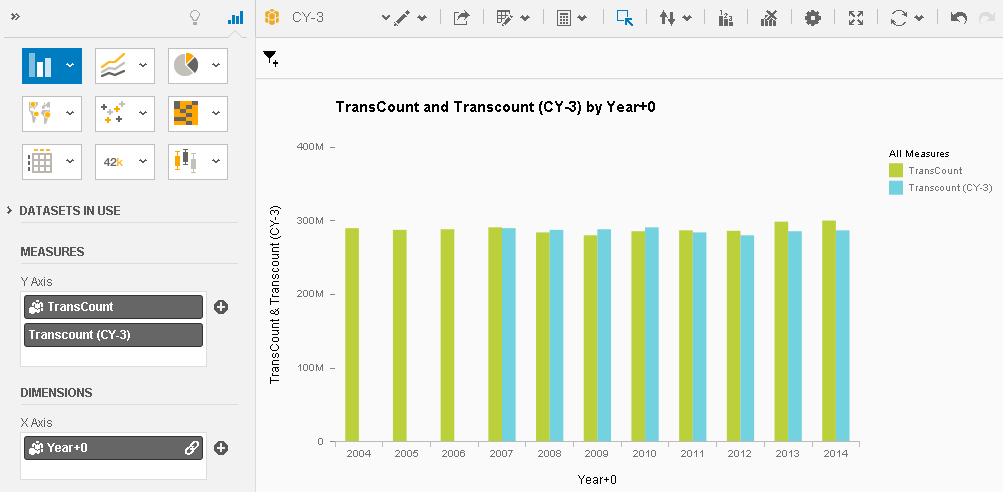
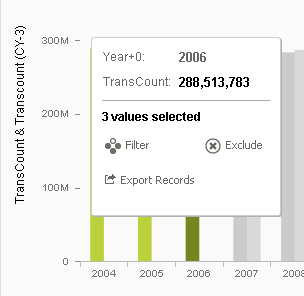
In other words, if I hover over the value for 2004 I will see it matches the Transcount(CY-3) value for 2007.
Next I want to Exclude the 2004 through 2006 numbers.
So now I am left with the correct bar chart.
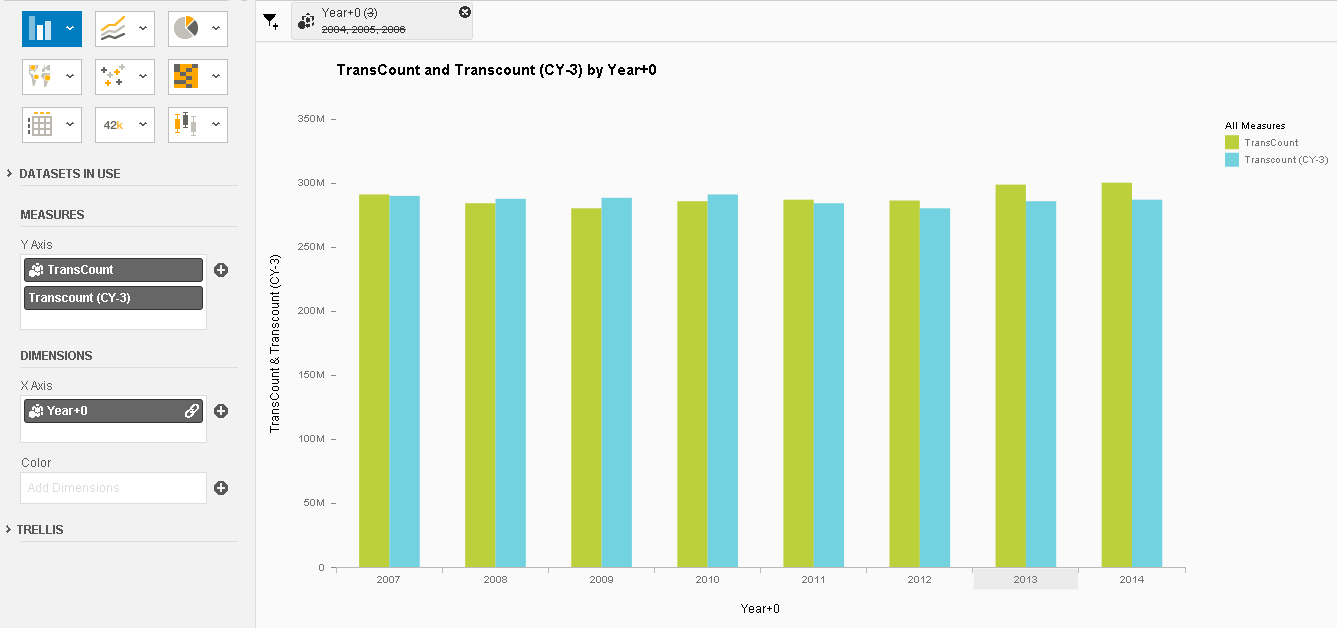
The next step is to now do some math between the two datasets. For example I wanted to calculate the variance. What is the difference between CurrentYear and CY-3? Nope. I needed to calculate the growth rate using the formula introduced above. The problem was in Lumira 1.28, there was no way to do this. Now you can!
Custom Calculations Across Datasets
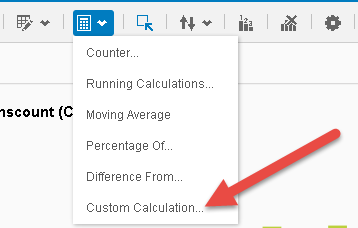
As soon as I got my hands on Lumira 1.29 I was able to find the new Custom Calculation feature two places. You can either:
- Use the menu at the top of the charting area
- Right Click on the measure and select Add Calculation >> Custom Calculation
 |
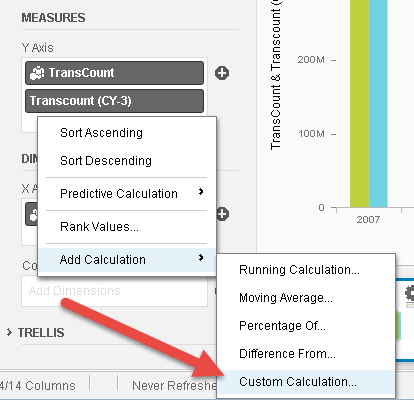 |
| From the Menu | From the Measure |
So let’s create this new custom calculation. Below you can see where I’ve highlighted a new and critical change. You can now select the “Dataset” of the fields you want to use in the calculation. This allows me to choose measure elements across both data sources:
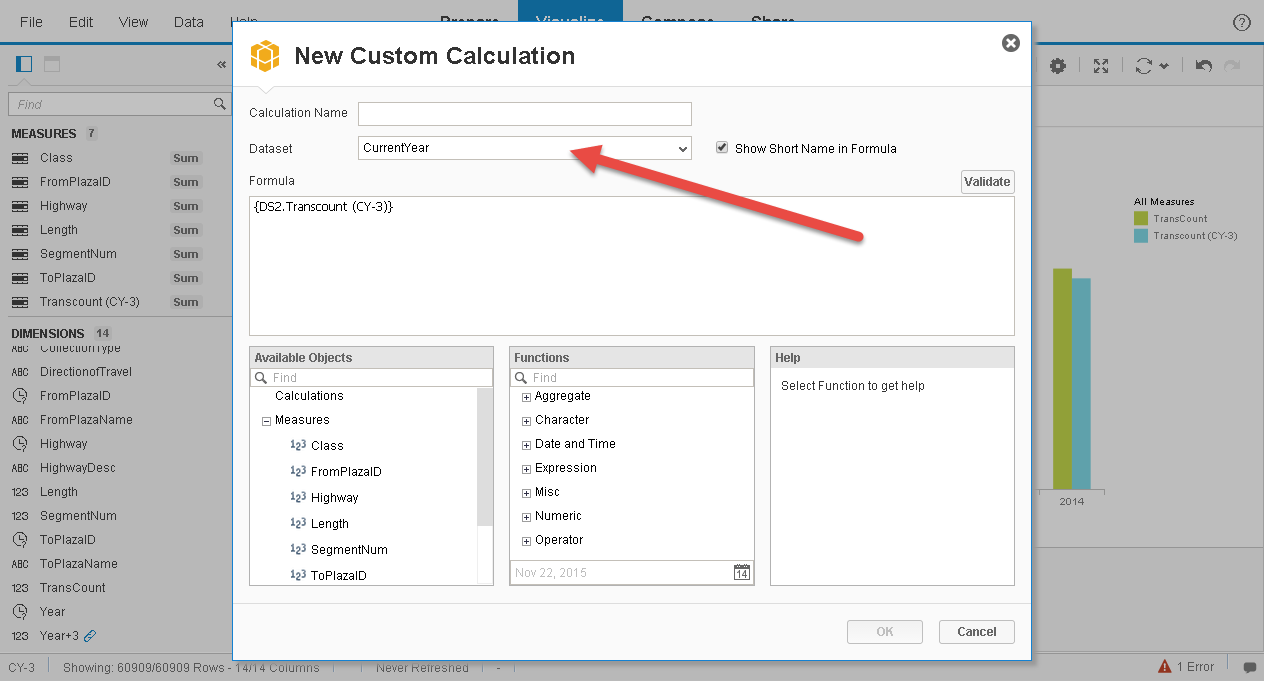
So now I can create the following new growth calculation:
Power({DS1.TransCount}/{DS2.Transcount (CY-3)},1/3) – 1
Once I add this new YoY calculation to the chart and remove the previous measure values I can see the following results:
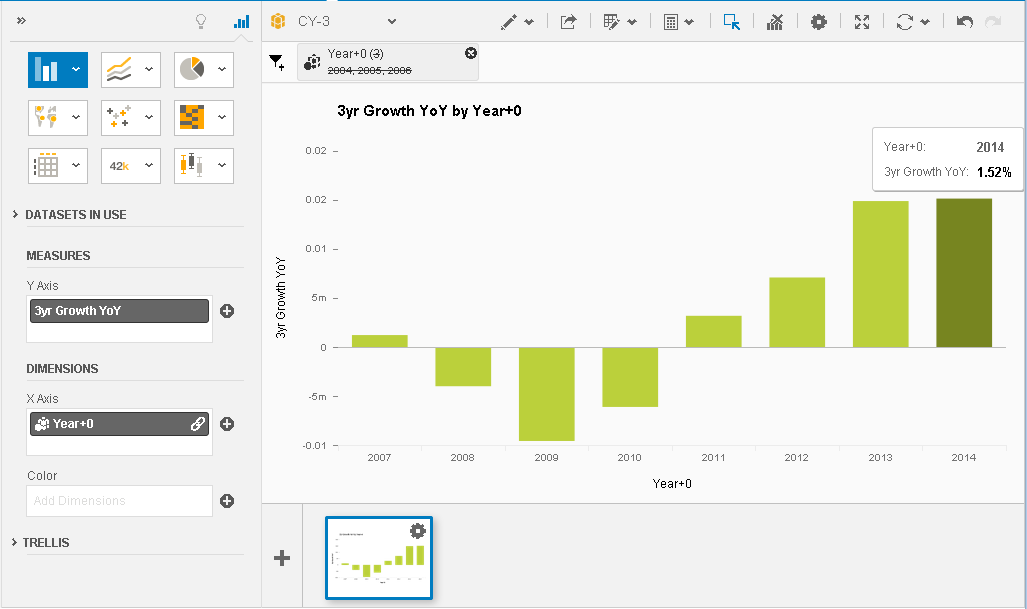
Now I have a dynamic growth calculation and I didn’t have to create dozens of formulas! It works beautifully.
Now the only existing limitation is that I cannot show the 3yr growth and the 5 yr growth in the same chart because each of them is linked to a different combination of results. (Year linked to 3Year) and (Year linked to 5Year). There is currently no way to linked more than two data sets together.
Exercise for You
If you would like to try this exercise out for yourself, I have attached the associated data file here. All you will need to do is load the dataset twice and then create the calculations as described above.
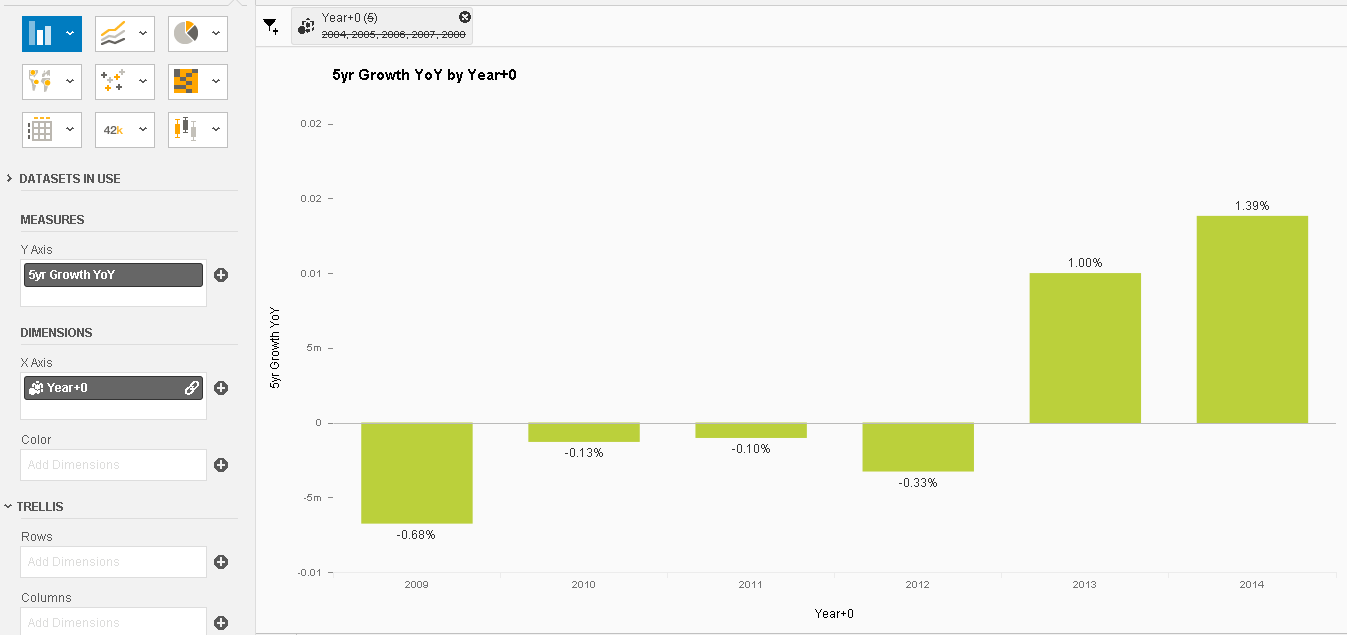
Now I’d like you to calculate the growth of Volume using the Growth Formula stated above, but this time instead of doing it for 2 yrs, do it for 5 yrs. Once you’re done, you should get a chart like this:
Wrap-up
Lumira 1.29 is a huge leap forward. The ability to do data blending and create new dynamic calculations across multiple datasets is very important capability indeed. This goes a long way to remove many of the limitations you may have encountered around data preparation and analysis thus far.
So the next question is… when will they be releasing Lumira 2.0? 🙂
Enjoy!
«Good BI»

You should take part in a contest for one of the finest sites on the
web. I’ll recommend this site!