In the first two blogs we were introduced to SAP Leonardo with:
- Embracing the Cloud Part 1 – Creating an SAP Cloud Platform trial account and creating our first HANA database in the cloud and
- Embracing the Cloud Part 2 – Configuring the SAP HANA Development within Eclipse and loading data into the SAP Cloud Platform
Now we want to connect our data to the SAP Analytics Cloud (aka BusinessObjects Cloud). We will do this in four key steps:
- Sign up for our SAP Analytics Cloud Trial Account
- Make our data accessible
- Connect to Our data
- Create a Story within the SAP Analytics Cloud
The SAP sales team has been running a number of HANA DBaaS Academies in which they can come onsite and walk your team through these steps so that by the end of the day your team will have hands-on experience with loading data into the SAP Cloud Platform and visualizing that data with the SAP Analytics Cloud. If you are interested in this for your team, you should reach out to your SAP sales rep.
SAP Analytics Cloud Trial Account
As with the SAP Cloud Platform, SAP is keen to have people try out their SAP Analytics Cloud capabilities and provide feedback. Already the Analytics Clouds have received a number of wave updates. As of the writing of this blog new capabilities are still being released every two weeks. If you are interested in reading about the latest capabilities, Carmen Choy has an excellent series of blog posts.
To sign up for your free SAP Analytics Cloud 30-day trial and in less than a minute you will have a trial account configured. All you need to do is go to their trial website and put in your email address. That’s it.
You will notice here that some of the branding still says SAP BusinessObjects Cloud below. Although the announcement of the name change from SAP BusinessObjects Cloud to SAP Analytics Cloud has been announced, not all of the internal systems have fully made the switch. As time goes on you should expect this branding to be updated to SAP Analytics Cloud.
After you put in your email address you will see two quick screens
… and then..
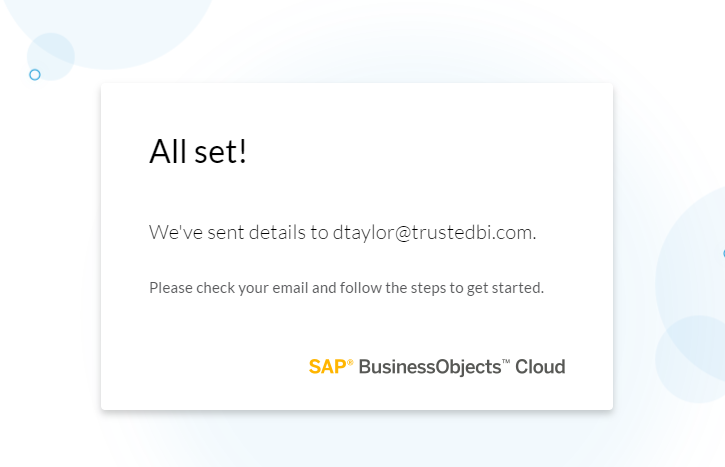
… done. That’s what you call Software As a Service!
In your Inbox you will get an email telling you to activate your count. The 30-day countdown starts as soon as you begin the activation. I wish they would limit the trial a different way rather than by a time limit, but for now that’s all we get. Fortunately by owning my own domain name I have access to unlimited email addresses. 🙂
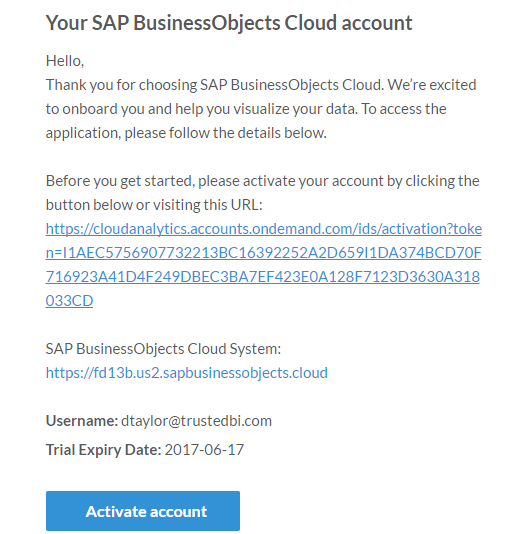
Go ahead and click on the URL and activate your account. The URL will take you to a login page
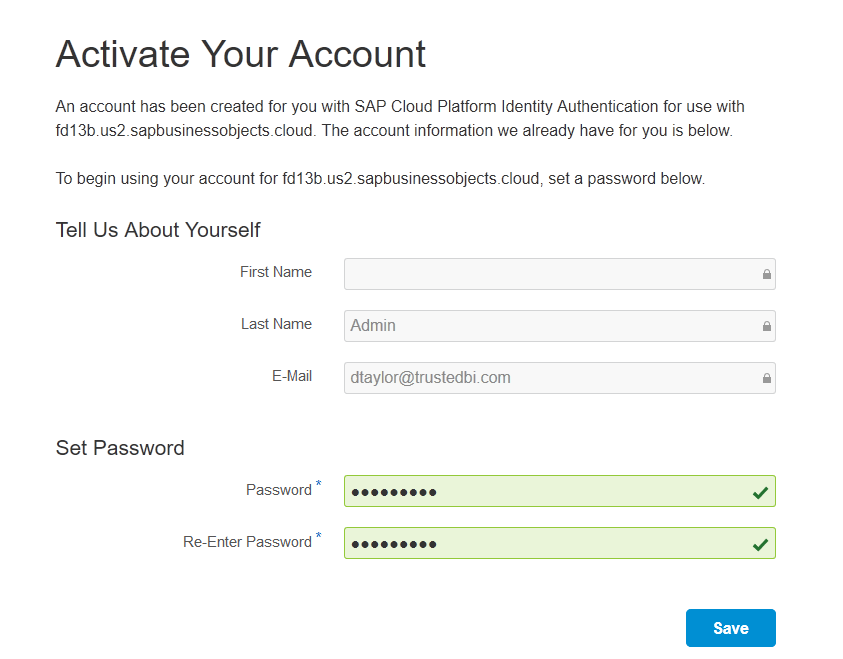
Once you click save, the system should return with the following message.
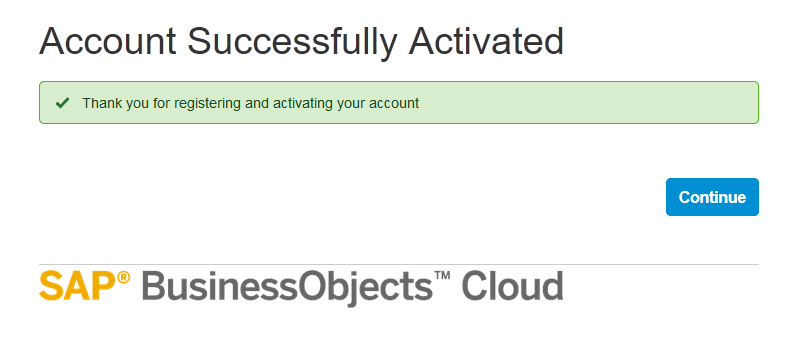
Now that we have our account activated let’s return to HANA and get our data ready. We need to make our data accessible to the SAP Analytics Cloud be exposing it as a HANA Calculation View, so let’s do that now.
Make The Data Accessible
This next step can be done by either the WebIDE or the Eclipse client. Since showed you how to configure the Eclipse client earlier we will use that.
Before you begin this step, confirm that you SAP HANA database is running by logging into your SAP Cloud Platform and verifying the status. If necessary start the database. (Remember to refresh the screen since the screen does not refresh automatically.)
We want to create a Calculation View.  The Calculation View is exposed
through the _SYS_BIC directory and therefore is accessible to external
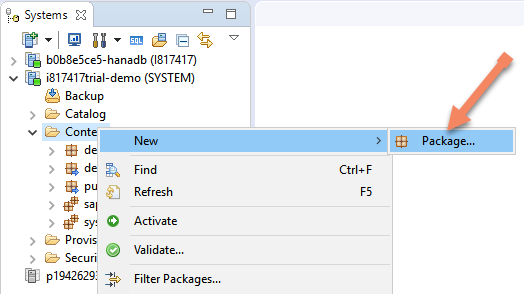
BI tools.  In our case we are going to create a Package and call it demo.
Right click on the Schema and choose New Package from the menu.
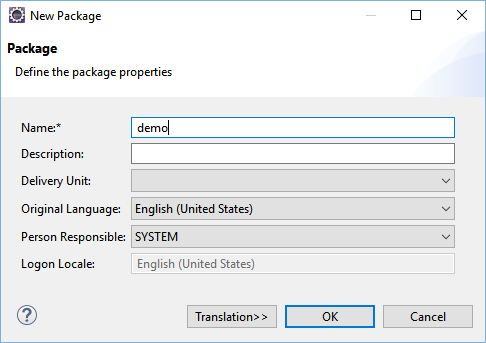
Next, provide the package a name, e.g. demo
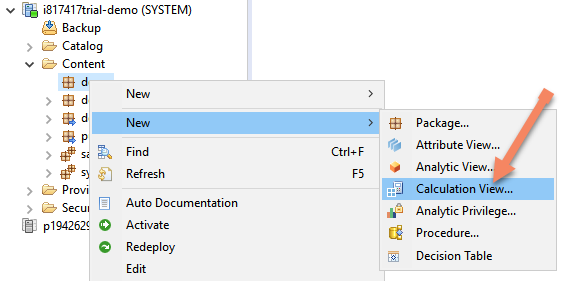
After naming the package we want to create a New Calculation View. We do this by right-clicking on the package and selecting Calculation View… from the menu.
If you are unfamiliar with how to create calculation views,
you might wish to review to this helpful video.  Although
the terminology is changing and SAP no longer differentiates
between Analytics Views and Calculation Views, it is still help
to watch how a Calculation view is created.
I will assume you are using the dataset from my previous blog, so let’s create a calculation view called, CV_INSURANCESALES. We want this Calculation View to be a standard cube, so we can accept the default settings.
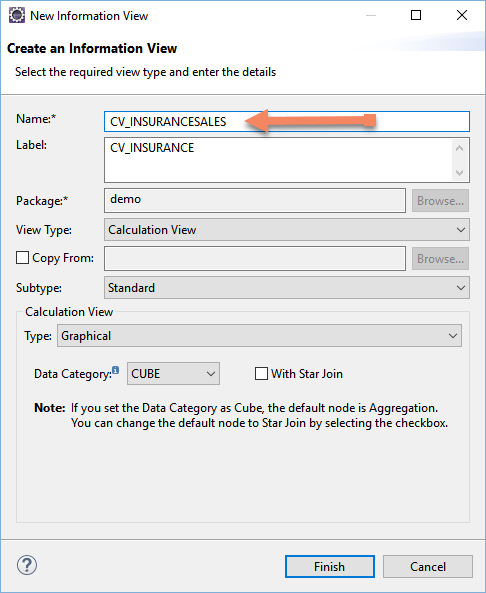
First, drag the table Insurance directly into the Aggregation box since we don’t need to join it to any other tables.
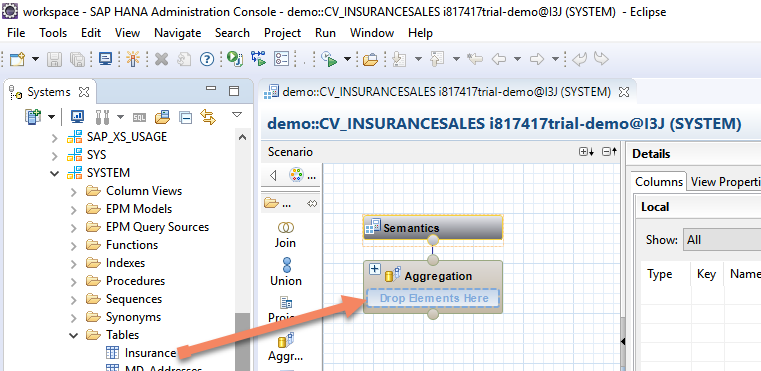
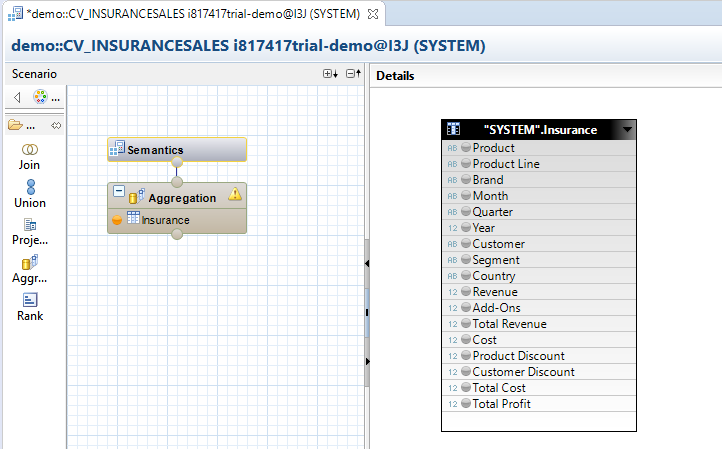
This is what you should see:
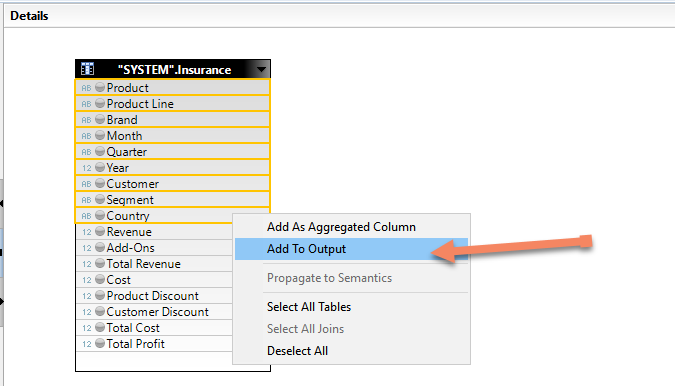
Next, in the area labeled Details, select the columns you wish to expose as dimensions. You can multi-select them by holding down the ctrl key and clicking on each one. Once you are complete, right click and choose Add to Output.
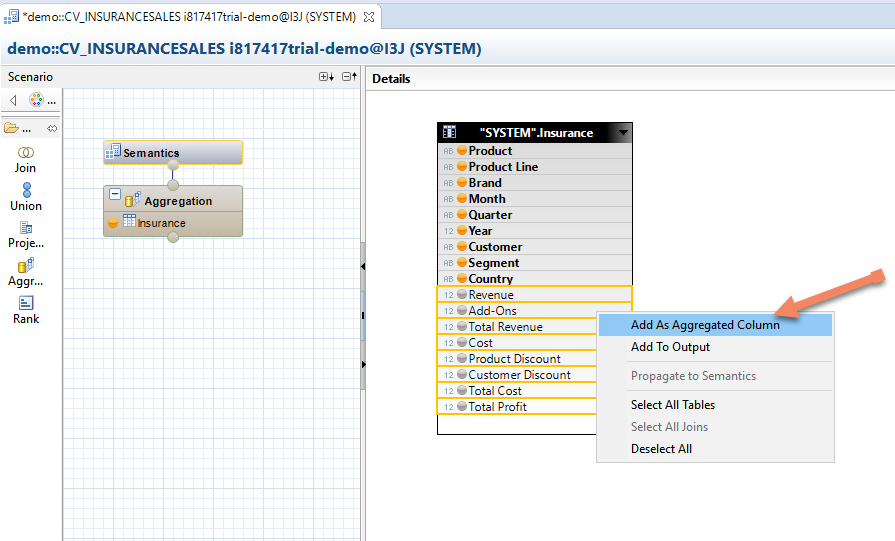
Next, select the columns you wish to expose as measures. Highlight them and then right click and choose Add to Aggregated Output. By default all our dimensions aggregate as SUM, so no further changes are required.
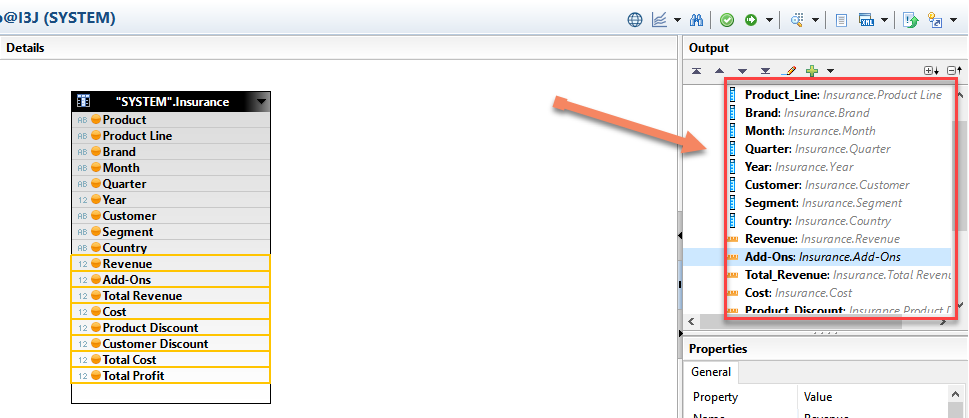
Now all our dimensions and measures should appear in the right panel.
We are almost done. The next step is to click on the Semantics Box . The contextual Details area will change accordingly. As a last step demo in the design of the model, we need to select each of the dimensions and categorize it as a dimension.
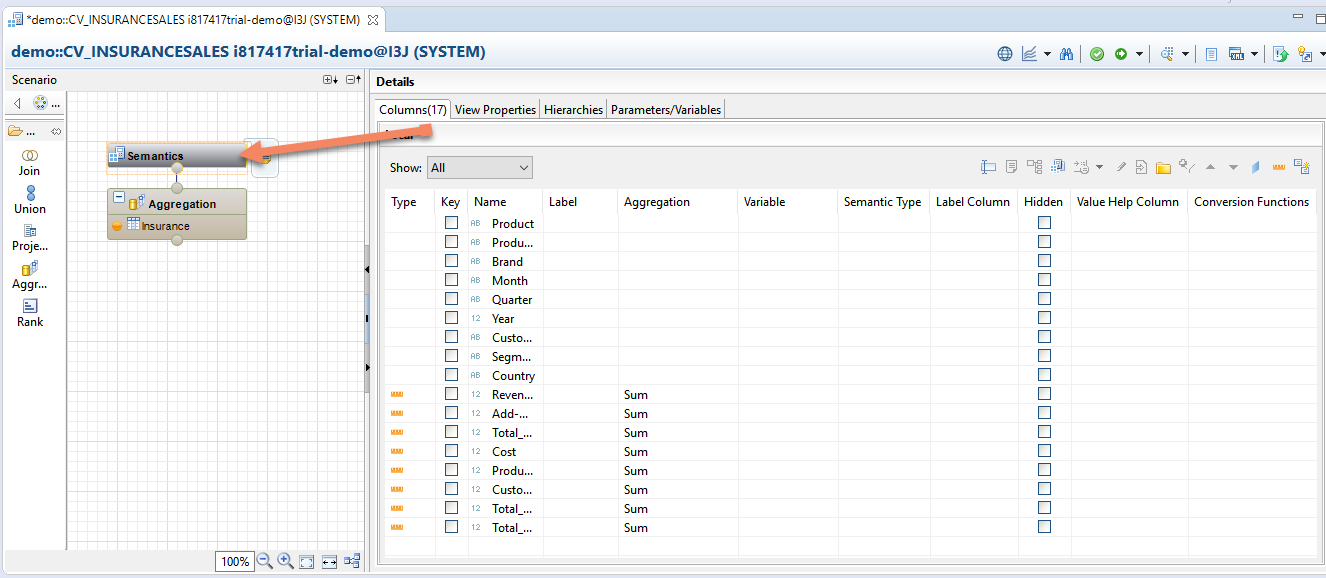
Highlight each of the Dimensions (all the items without an orange ‘measure’ icon in the leftmost column), and click on the very small blue square in the menu bar.

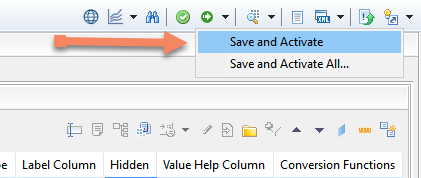
Now the final step is the Save and Activate our model. This will validate the model and activate it so that it becomes part of the _SYS_BIC schema within HANA. To activate your model, click on the dark green circle in the top right menu.
As the model runs, you should see the log files update below.
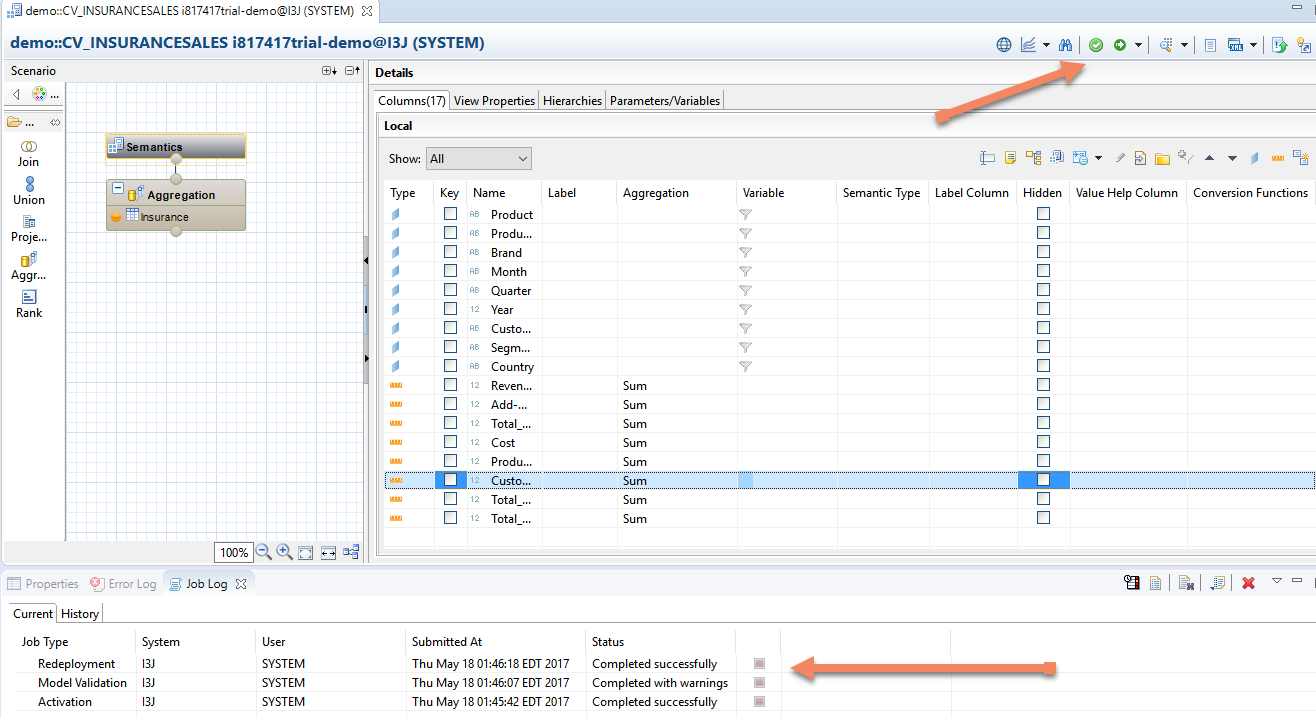
Once you see the message Completed successfully, you are ready to consume this model from with SAP Analytics Cloud.
If you are interested in watching a similar exercise in video form, check out this youtube video.
Connect To Your Data
Let’s log into our SAP Analytics Cloud environment. You may notice from to time a delay in the time it takes from when you click on something to the time you see the screen update. I have noticed that SAP Analytics Cloud isn’t the best at telling you when “it’s working”, so if in doubt give it some time to paint the screen – especially when it’s doing something for the first time. If you are using a trial account, it’s hard to know what the URL will be that you have been assigned. In my case I was assigned a trial account on a tenant named: fd13b.us2.sapbusinessobjects.cloud, so my URL will be.
https://fd13b.us2.sapbusinessobjects.cloud/
Based on the rebranding of SAP BusinessObjects Cloud to
SAP Analytics Cloud, the base URL made change.
This is the URL that you will want to bookmark, not the URL that asks for your username and password. The authentication process is handled by a separate identity server that is not necessarily running within the same namespace as your SAP Analytics Cloud account.
Once you have logged in with your username (email) and password, you should see the following welcome screen:
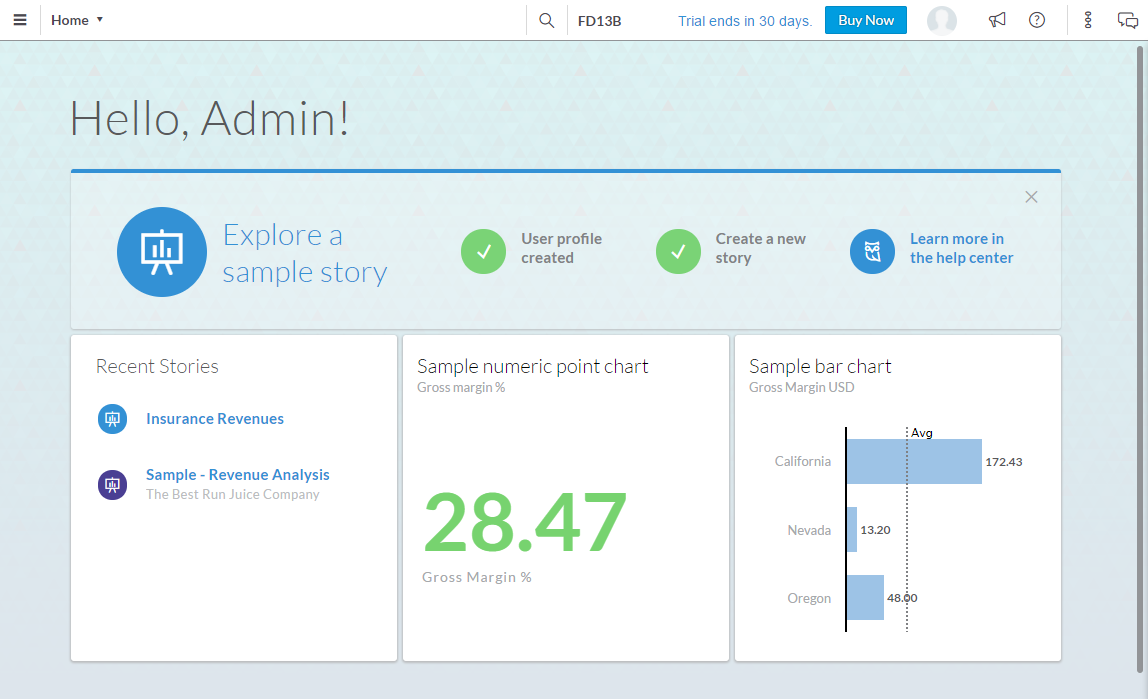
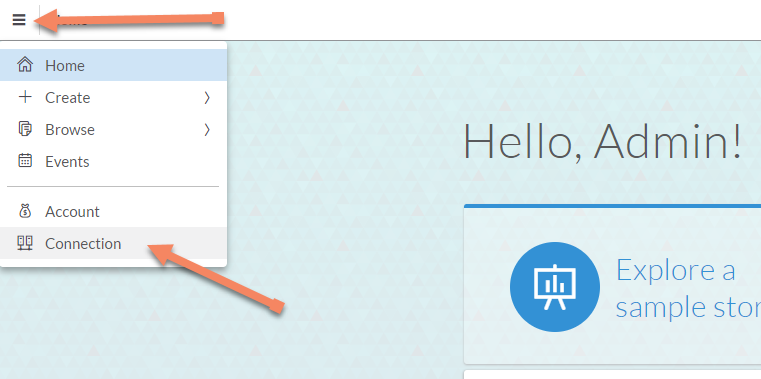
By default your account will be loaded with a sample set of data and content. Feel free to review these stories and get familiar with the SAP Analytics Cloud navigation. The first thing we need to do is to use SAP Analytics Cloud to create a connection to our HANA data running within the SAP Cloud Platform. This is very easy to do. Simply select Create Connection from the menu:
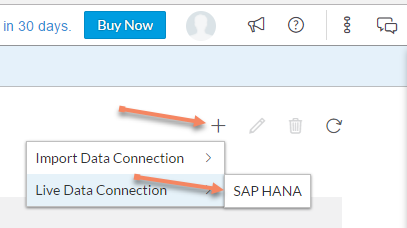
From here we will decide which type of connect we want to create. Today there are “Live Connections” available for both HANA and SuccessFactors and many more will be added in the future. However if you want additional live connectivity today, I would recommend you check out SAP’s partner APOS provides live connectivity to other data sources such as Microsoft SQL Server, etc. with it’s Data Gateway for SAP Analytics Cloud.
On the right hand side you will see a (+) plus button. Click this to add a new HANA Connection.
Next you’ll get a pop-up screen and be asked to fill in the relevant details:
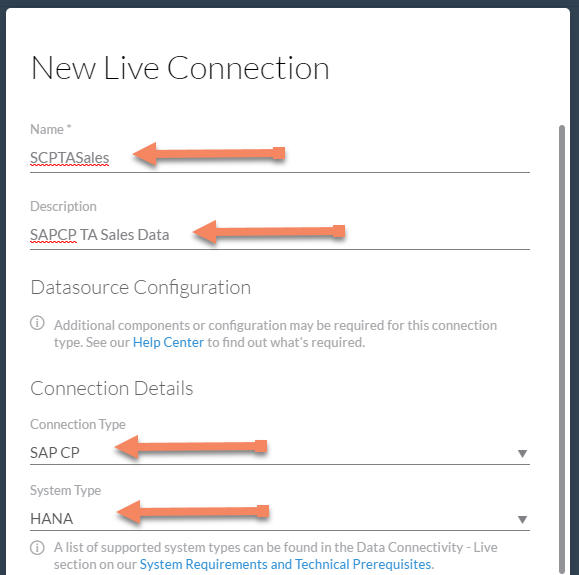
Continue to scroll down:
- SAP CP Account – Enter your account name. If it is a trial account then you will include the “trial” at the end of the name. (We went over this in more detail when we showed setting up the HANA account in this earlier blog.
- Database Name – This is the name of your HANA database within your SAP Cloud Platform environment.
- Landscape Host – If you are using a Trial account then it will be Trial, otherwise you need to pick the correct data center.
- User Name – This is the username for your HANA database within the SAP Cloud Platform environment.
- Password – This is the password for your HANA database within the SAP Cloud Platform environment.
… so fill out the bottom section as well.:
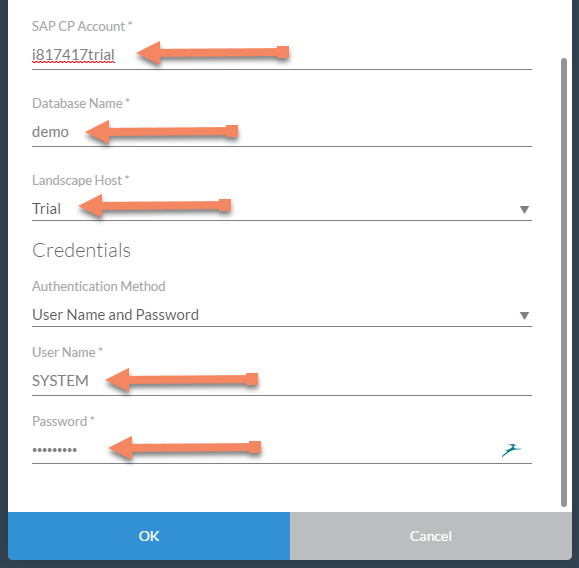
Once you click okay, the connection will validate what you’ve filled in by connecting to the HANA database. If you are prompted again for a username and password in a pop-up window, either your HANA database is not currently running or you are using the incorrect user name and password.
This Live Connection is now added to our landscape:

Next we want to connect to our CV_INSURANCESALES view within the SAP Cloud Platform. To do this we need to create a model. Choose Create Model from the menu:
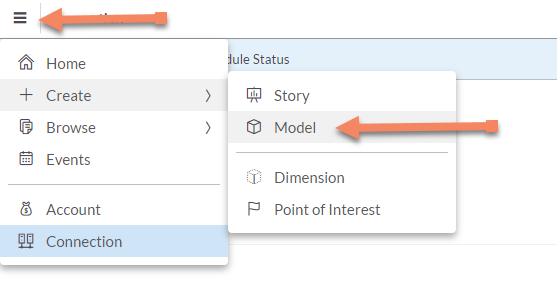
From this menu we will select the live data source:
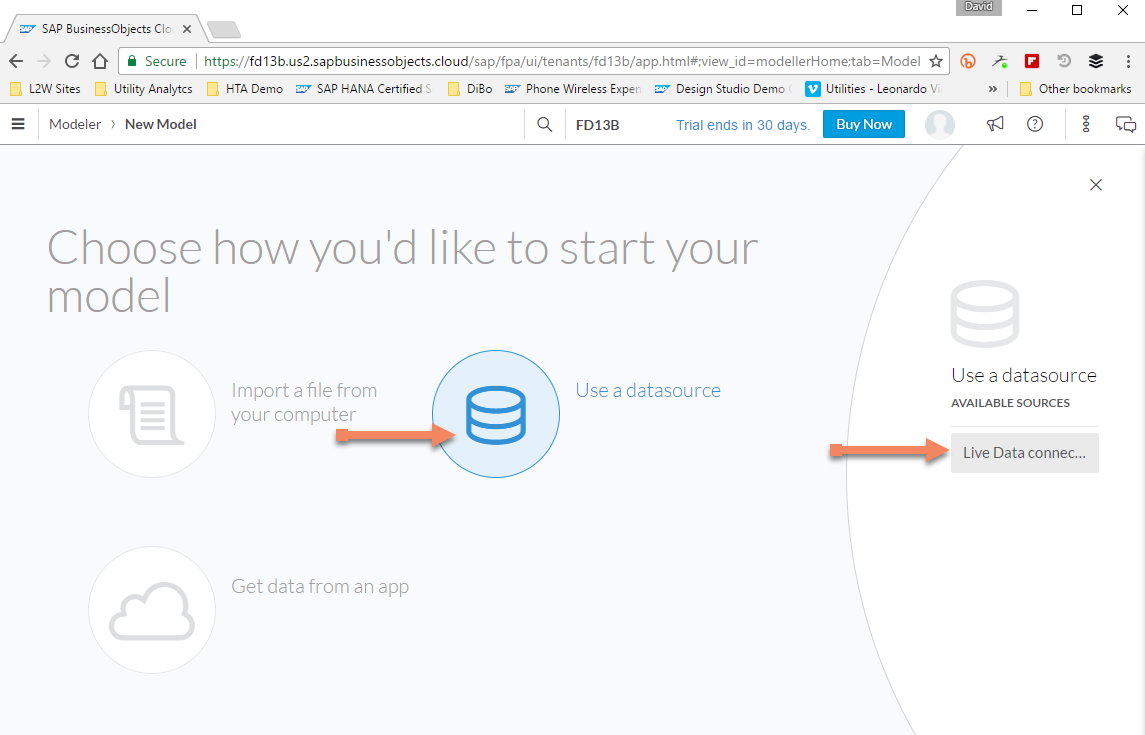
and then choose the data source from our HANA database in the SAP Cloud Platform.
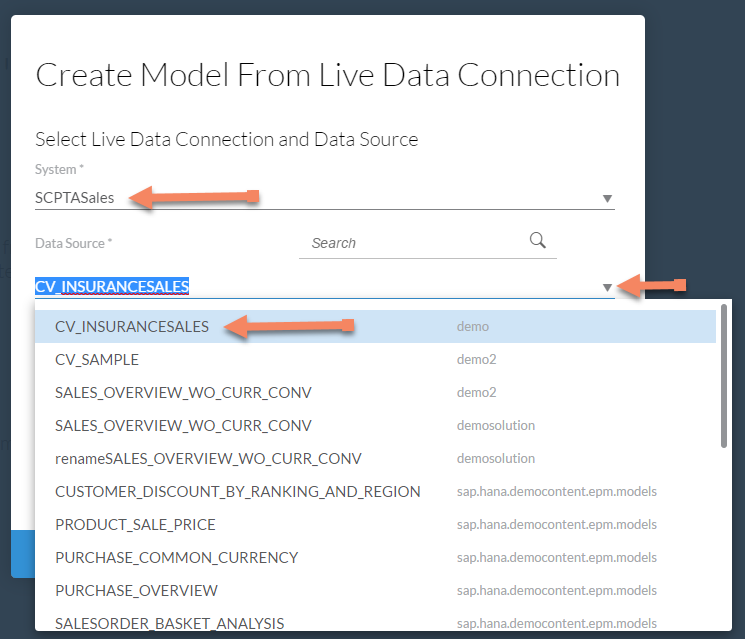
You will also want to name your model. In my case I used the name Insurance. Once you click OK, the system will open up in the Modeler view with the list of measures. This may appear confusing if you’ve not seen it before. Because the SAP Analytics Cloud has a Budgeting & Planning framework at it’s core, within a mandatory “Accounts” dimension is where the measures are stored. (This allows for versions of measures which is critical for Budget & Planning scenarios.)
If you want to change some of the measure descriptions or aggregation methods you can do it here by updating the values directly in the grid. Once any changes you want to make are complete, click the Save icon on the menu.
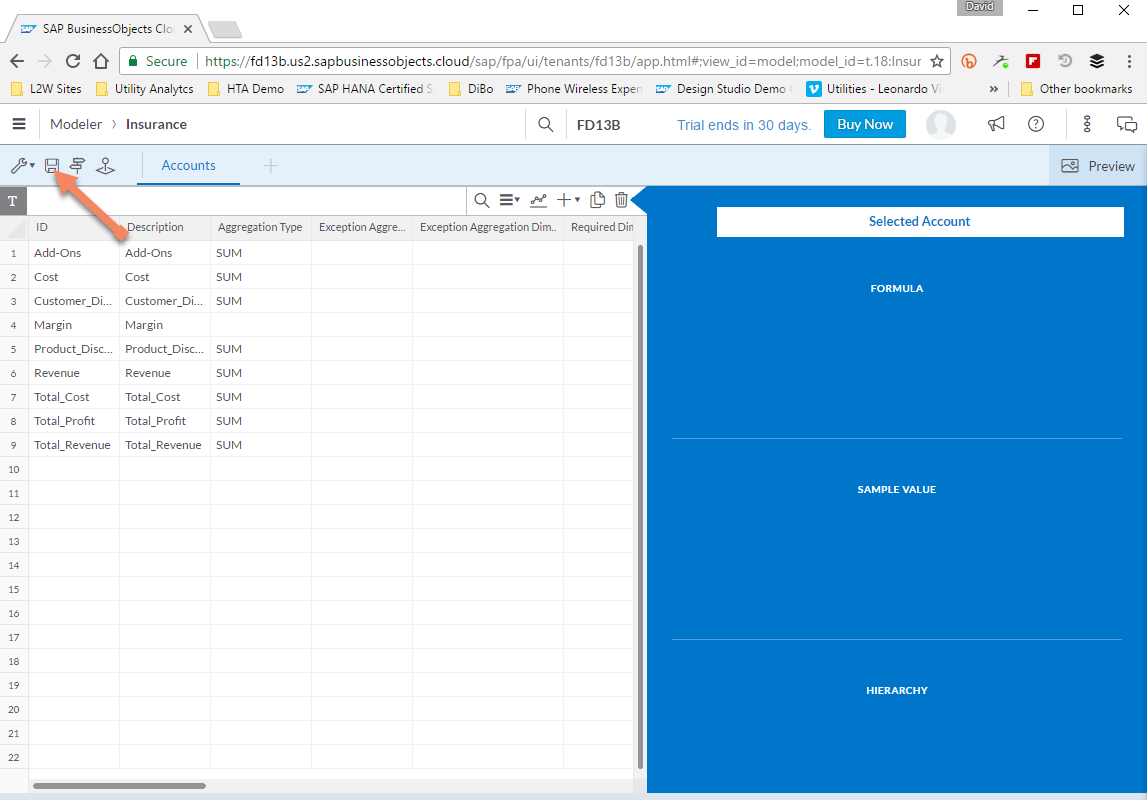
and your changes will be saved:

All the foundational elements are in place.
- Our data has been loaded into the SAP Cloud Platform.
- We have establish a connection between the SAP Analytics Cloud and our data in the SAP Cloud Platform.
- We have created a model on top of our data.
So now is the fun part. Now that everything is connected we can begin to slide and dice the data and get some insights.
Create a Story within the SAP Analytics Cloud
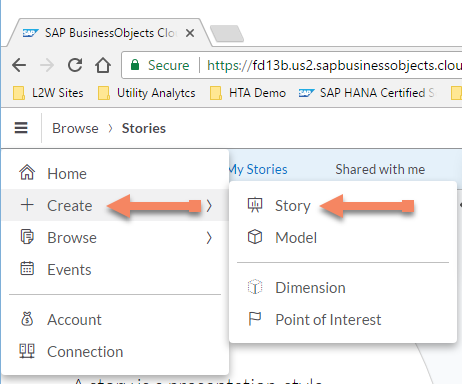
SAP Analytics Cloud allows you to consume interactive Analytic applications from the same interface that you use to create them. Let’s create our first story by selecting Create > Story from the menu:
This will open up a story wizard. You can selectd from existing template or start with your own blank canvas. For this exercise let’s start with a blank Canvas by selecting Add a Canvas Page.
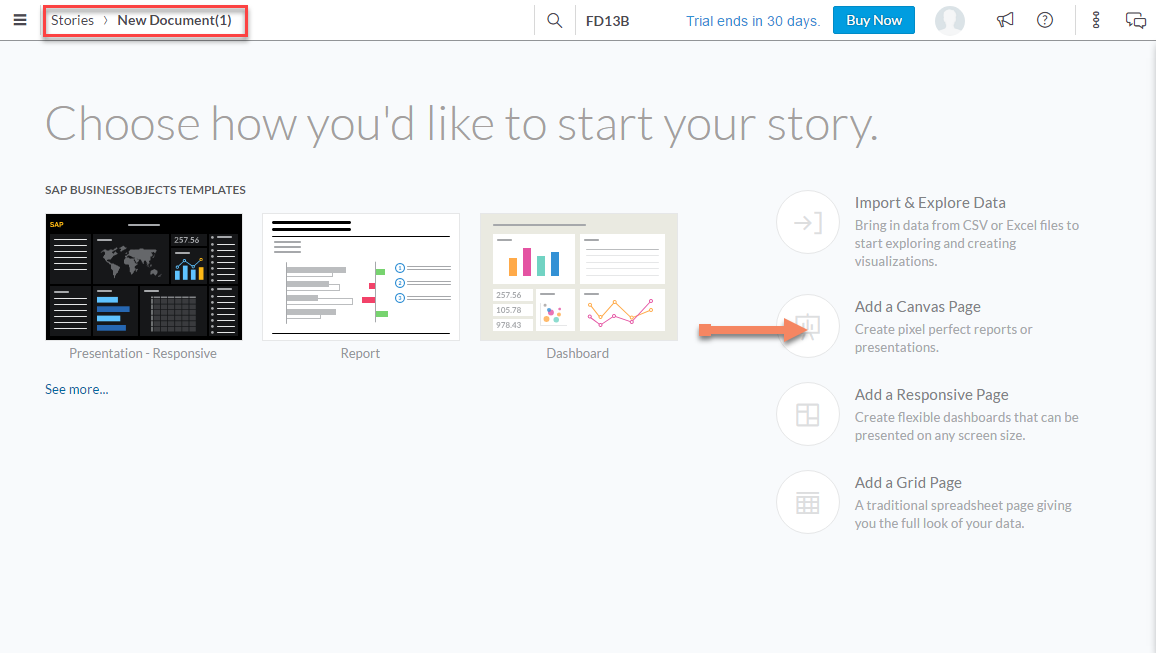
Next we will chose whether we want our page to be used for data exploration (data sources on the left) or for traditional Analytic elements. In our case let’s select a chart so that we can begin to visualize our data.
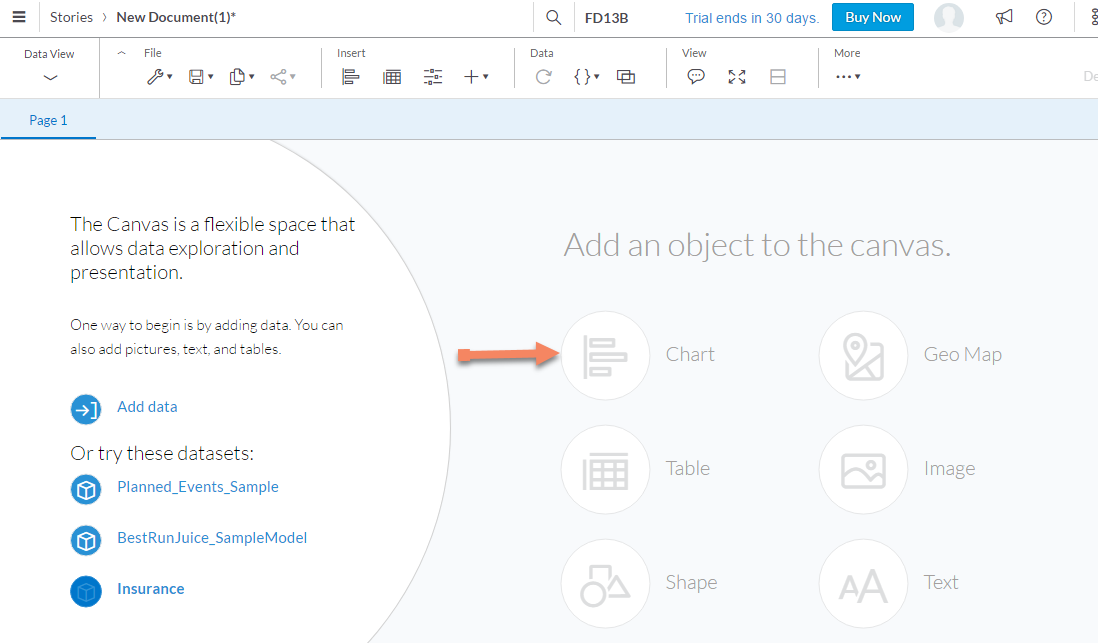
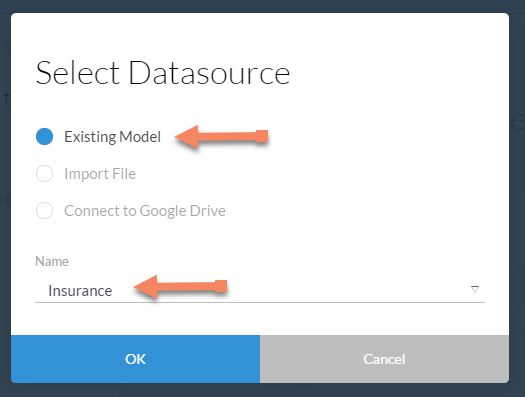
Next, you will choose your data source. We want to select the model (data set) to connect our chart to. Let’s select Insurance.
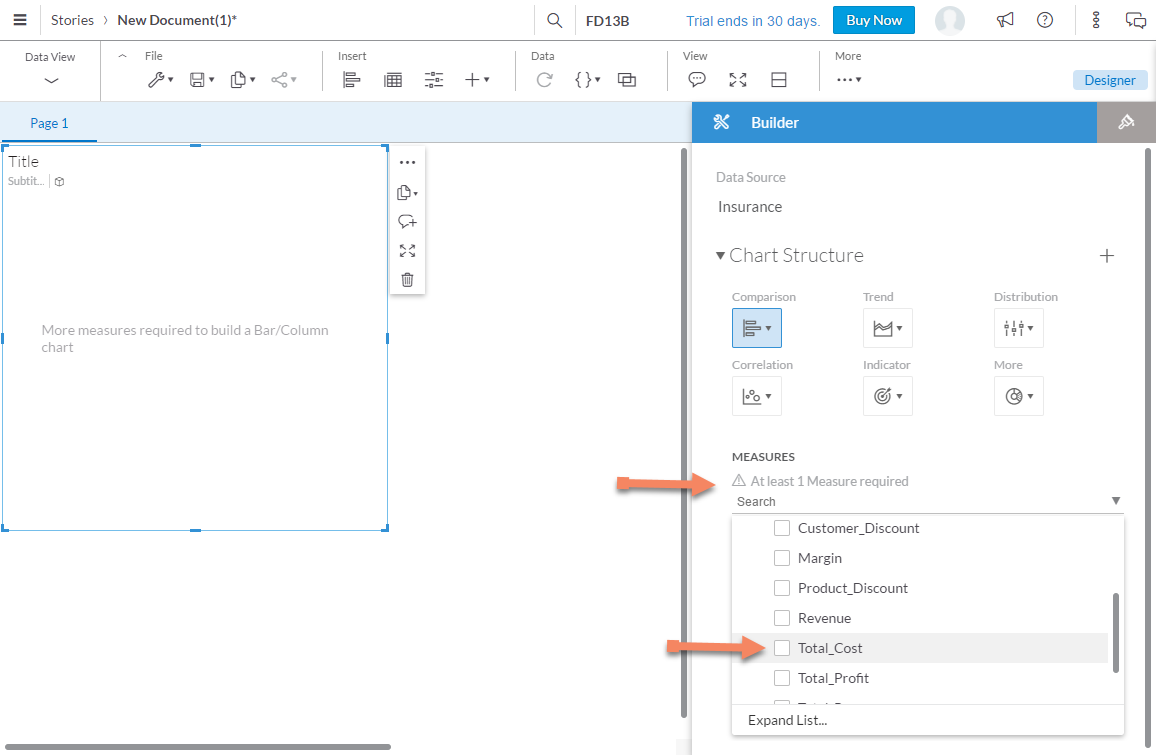
Next you will want to select Total_Cost as your measure:
Once you have selected the measure zzzTotal_Cost and Product_Line, the chart should appear like the one below.
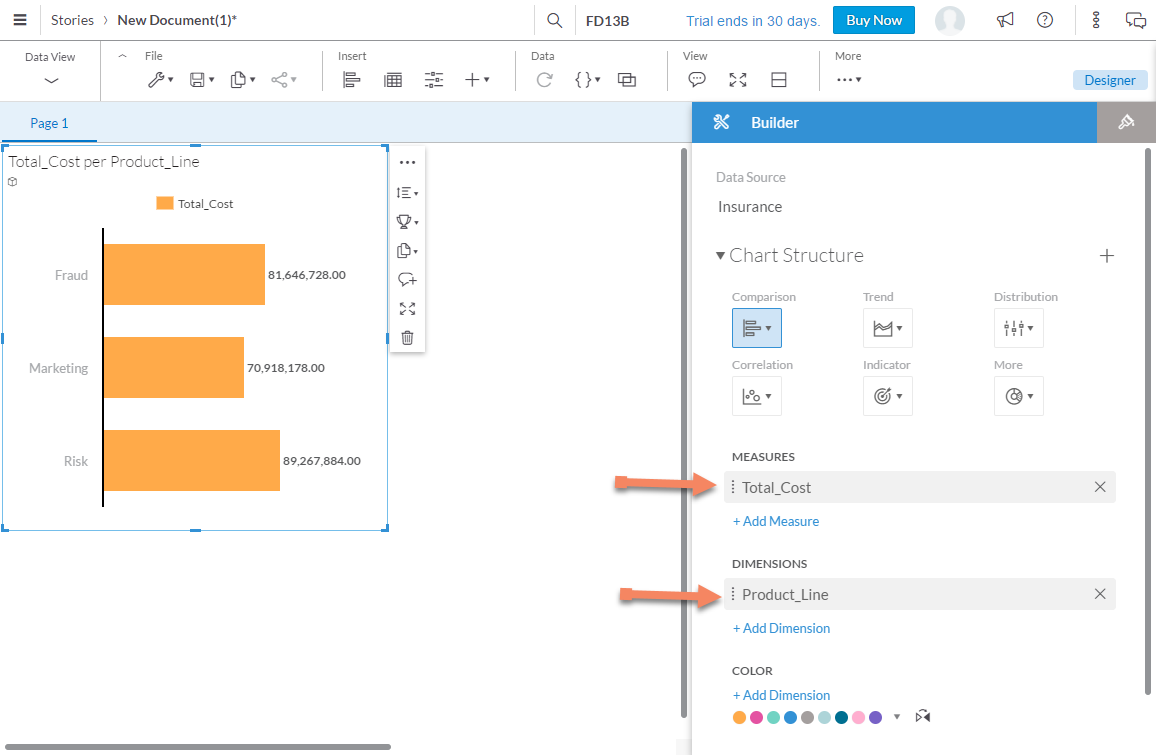
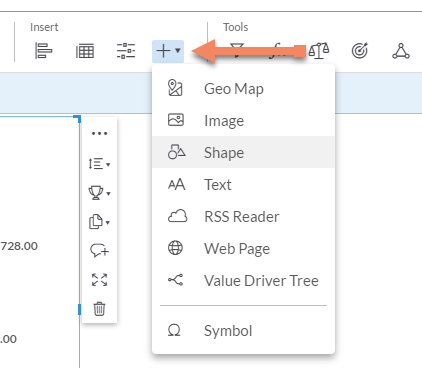
The (+) plus button in the Insert menu above is where you can add additional elements to the canvas. Feel free to play around and get comfortable with the Designer Interface.
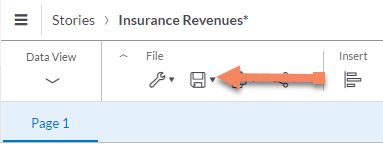
Once we have updated the canvas to meet our needs, we will want to save our story. Click the save icon and give your story a name.
Congratulations, you have created a story within SAP Analytics Cloud connected to a Live data source. I encourage you to play around and get comfortable with the Designer. One of my biggest challenges was overcoming my habit of constantly using right-click to to look for shortcut options because within legacy BusinessObjects the web interface still fully supported the right-click paradigm.
For more resources about learning to use many more capabilities within SAP Analytics Cloud, please check out these youtube videos.
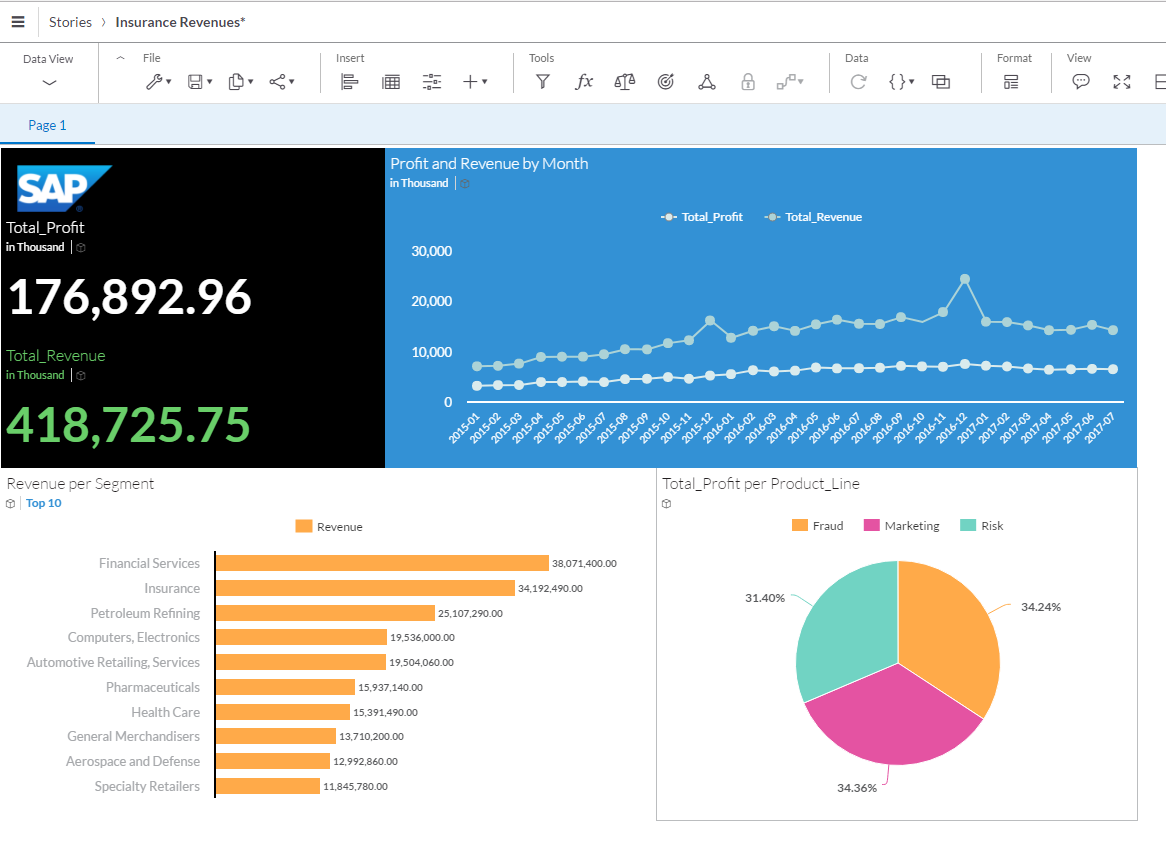
Here is a story I created using the data we just uploaded. It look about 10 minutes to create.
I hope you find these blogs helpful in understanding how you can begin to get familiar with managing and analyzing your data within SAP’s cloud offerings.
Conclusion
Mike Flannagan shared his vision around SAP Analytics at Sapphire 2017 yesterday and the cloud was a cornerstone of his message. This is the primary go forward strategy for Analytics for SAP so we should be expecting significant investment by SAP in the development of this solution over the coming months and years.
This solution is still in it’s infancy but SAP is well on the road to establish a strong offering for cloud-based analytics against any data source.
«Good BI»

